Precipitation
1 Precipitation
- Includes rain and snow
- Replenishes surface water bodies
- Increases soil moisture
- Recharges groundwater
- Derived from atmospheric water vapor whose principal source is evaporation from the oceans
2 Evaporation, condensation, equilibrium
Evaporation
- when a liquid is heated or
- when the pressure on the liquid is decreased
Condensation
- when a liquid is cooled or
- when the pressure on the liquid is increased
Equilibrium
- when the air vapor pressure equals the surface vapor pressure
- the air is said to be saturated if the air and water temperatures are the same
3 Precipitable water
The total amount of water in a unit air column or the amount of water that would be obtained if all water vapor in that column were condensed out.
\begin{equation} W=\int_0^z\rho_w\,dz \label{eq:precipitable} \end{equation} where “$\rho_w$ is the absolute humidity and $W$ is the depth of precipitable water in centimeters”...?
$\rho_w$ in mass per volume, $z$ in height, but $W$ in depth? Can you explain?
4 Formation of precipitation
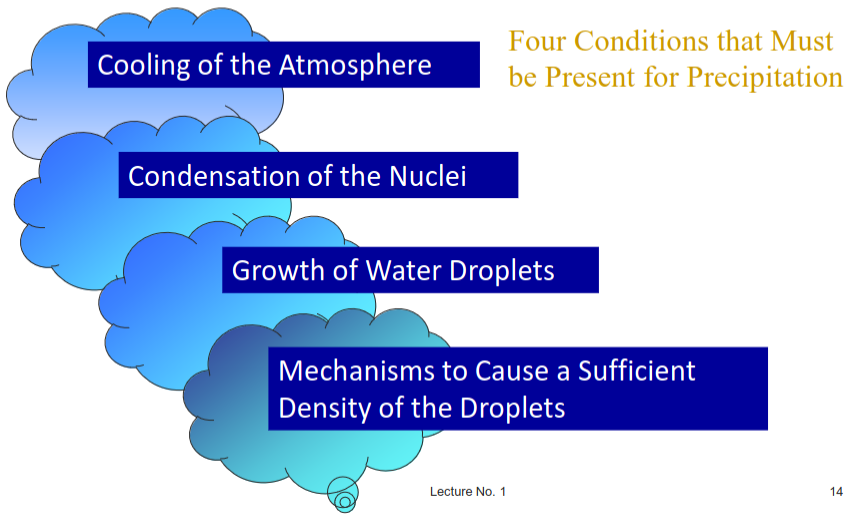
Two processes supporting the growth of droplets of sufficient mass (500–4000 $\mu$m in diameter):
- Coalescence process
- Ice crystal process
4.1 Coalescence process
- Droplets grow by contact with others
- Very large drops (order of 7 mm in diameter) break up into smaller droplets
- Repeat...
Important in tropical regions or in warm clouds.
4.2 Ice crystal process
- At subfreezing temperatures below about $-40^\circ C$, certain particles (e.g., clay minerals, organic/ordinary ocean salts) serve as freezing nuclei
- Vapor pressure over water droplets higher than over ice crystals
- Condensation
“Rain-making” technologies take advantage of this process.
4.3 Adiabatic cooling
In thermodynamics, “adiabatic” means “without transferring heat or mass between the system and its surroundings.”
- As a parcel of air is lifted, its volume expands, working against the environment
- Work done reduces its kinetic energy
- Reduced kinetic energy means reduced temperature (no heat transfer took place between the air parcel and its environment)
- If this cooling occurs to the point of the dew point, condensation happens
- Cool air is heavier than warm air
- Heavy droplets forcefully drag down the cool air
5 Precipitation types
- Convective precipitation
- Orographic precipitation
- Cyclonic precipitation
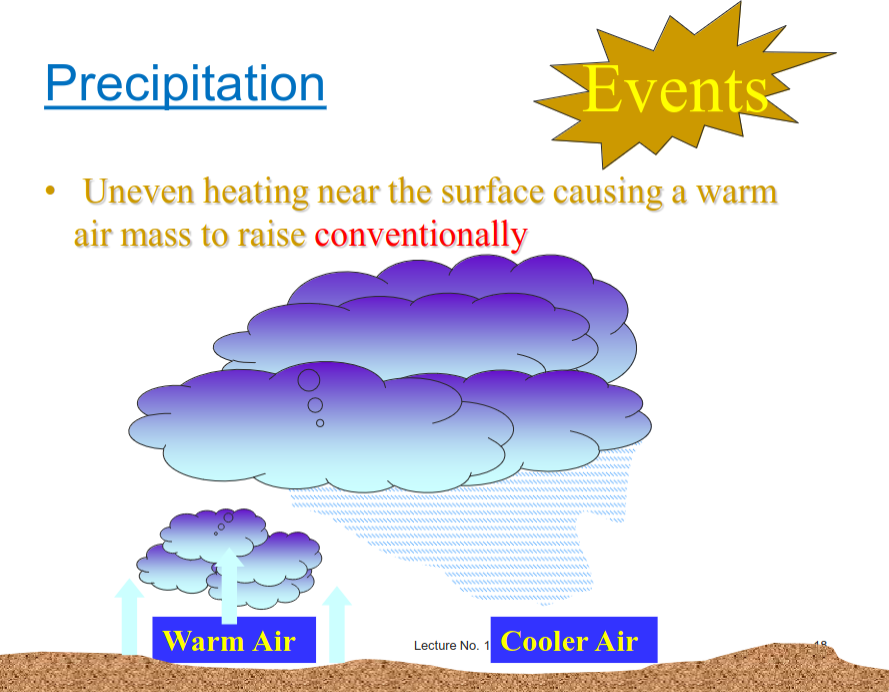
5.1 Convective precipitation
Typical in the tropical regions
- By heating of the air at the ground interface
- The amount of water vapor increases
- Warm air is lighter than cool air
- Dynamic cooling takes place
- Condensation and precipitation
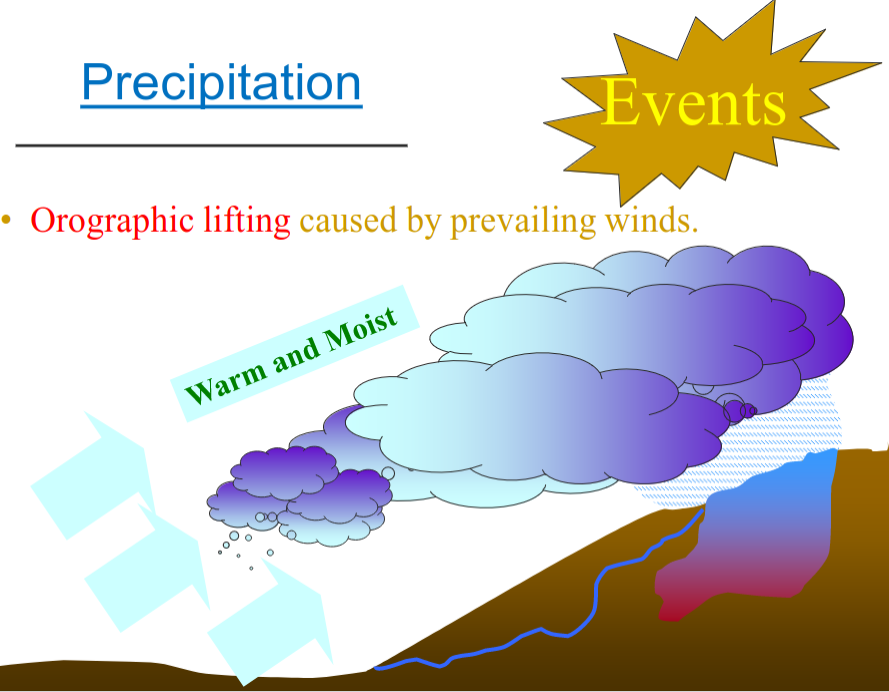
5.2 Orographic precipitation
Typical in mountain ranges and common on the West Cost of the US
- Results from the mechanical lifting of moist horizontal air current
- Cooling of the moist air
- Condensation and precipitation
5.3 Cyclonic precipitation
Associated with the movement of air from high-pressure regions to low-pressure regions
Pressure differences created by the unequal heating of the earth’s surface
Classified as frontal or nonfrontal
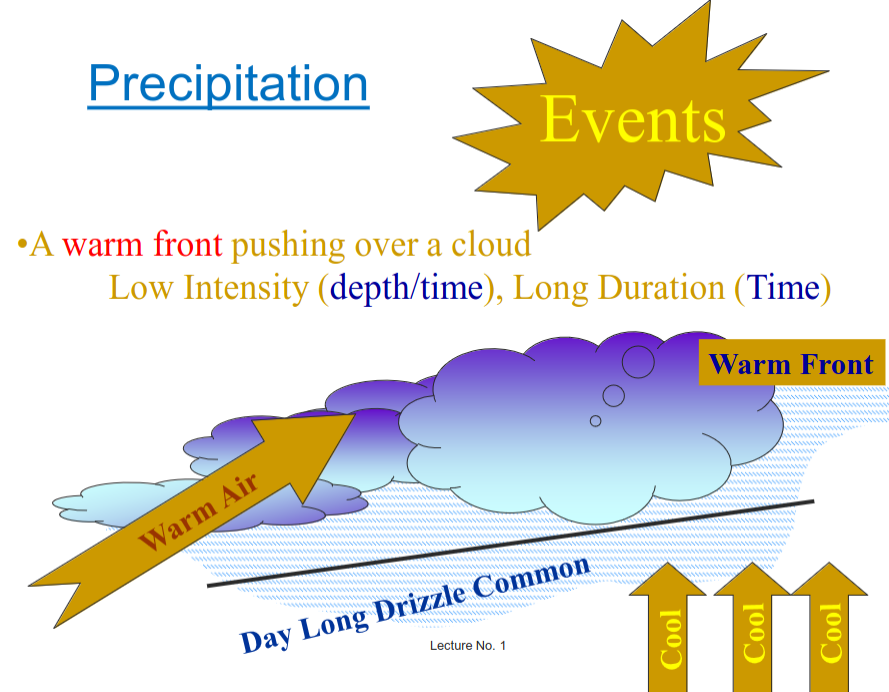
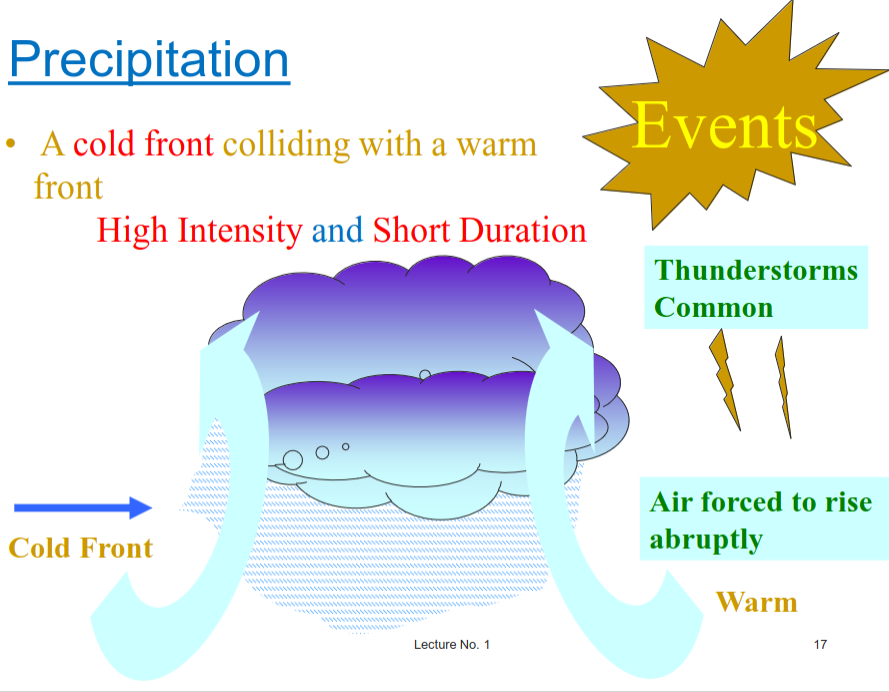
5.3.1 Frontal cyclonic precipitation
See Figure 4.1.
- Warm front
- Cold front
- Stationary front
5.3.1.1 Warm front
5.3.1.2 Cold front
5.3.2 Nonfrontal cyclonic precipitation
Convergence of the inflow into a low-pressure region
6 Precipitation data
6.1 Rainfall intensity and hyetographs
Rainfall intensity is the average rainfall depth for a given rainfall duration. It is expressed in depth per time (e.g., in/hr or mm/hr).
A hyetograph is a plot of the rainfall intensity over time (i.e., rainfall intensity time series).
6.2 Gross and net precipitation
\begin{equation} P_e = P - L \label{eq:net_pcp} \end{equation} where $P_e$ is the net (excess) precipitation, $P$ is the gross precipitation, and $L$ is the sum of all losses.
6.3 Point precipitation
Ground gauges measure precipitation events at specific point locations.
Point precipitation data is used to
- estimate areal variability of precipitation,
- develop design storms for small watersheds, and
- derive intensity-duration-frequency (IDF) curves (e.g., Figure 4.7)
6.3.1 Estimating point rainfall
Use the inverse distance weighting (IDW) method.
\begin{equation} \hat{P}=\frac{\sum_i P_iW_i}{\sum_i W_i} \label{eq:idw} \end{equation} where $\hat{P}$ is the estimated point rainfall, $i$ is the gauge number, and $P_i$ and $W_i$ are the point rainfall and weight at gauge $i$, respectively.
See Figure 4.8 and Table 4.1.
Let’s try it in Excel!
6.4 Areal precipitation
In many cases, just one gauge may not be ideal for representing a large watershed depending on
- its distance from the centroid,
- its intensity,
- the watershed area,
- the topography,
- the nature of the rainfall of concern (short vs. long term), and
- the local storm pattern
For hydrologic analysis, the areal distribution of precipitation plays an important role. See Figure 4.9.
Average rainfall depths are commonly used, but there are different ways to estimate them:
- Arithmetic average
- Isohyetal method
- Thiessen method
6.4.1 Arithmetic average
Best for uniformly distributed gauges over a flat area
6.4.2 Isohyetal method
- Interpolate between gauges
- Connect equal rainfall depths (isohyets)
- Take the area-weighted average
See 4.11.
6.4.3 Thiessen method
- Compute the Delaunay triangulation of gauges
- Connect the circumcenters of neighbor Delaunay triangles
See Figure 4.13.
6.4.4 Thiessen method example
7 Probable maximum precipitation
The probable maximum precipitation (PMP) shows “the critical depth-duration-area rainfall relation for a given area and season which would result from a storm containing the most critical meteorological conditions considered probable” (Viessman and Lewis, 2002).
Various factors controlling the rainfall intensity are considered:
- air-mass properties
- synoptic situations during recorded storms,
- topography,
- season, and
- location
Used for flood flow estimates.
8 Exercises
- Example 4.1
- Problem 4.1
- Problem 4.3 Thiessen polygons
- ncdc_prcp_stations_nm.gpkg
9 Homework: Areal precipitation
Problem 4.3. Show your full work.
