How to extract cell values from a GeoTIFF file using NumPy
1 Introduction
Try these exercises first:
- How to read a GeoTIFF file as a NumPy array using GDAL
- Exercise: Plot a GeoTIFF file
- Exercise: Calculate the average cell value of a GeoTIFF file
In this exercise, we want to extract cell values that satisfy certain conditions. Our goal is not to create subsets of a GeoTIFF file as 2-dimensional maps. Instead, we’re only interested in their cell values, not their locations. Use elevation.tif. To extract cells while retaining their location information, see this exercise.
2 Python code
from osgeo import gdal
import matplotlib.pyplot as plt

def read_geotiff(filename):
    ds = gdal.Open(filename)
    band = ds.GetRasterBand(1)
    arr = band.ReadAsArray()
    del ds, band
    return arr

elev_arr = read_geotiff("elevation.tif")
elev_mean = elev_arr.mean()
elev_std = elev_arr.std()

print("# Elevation statistics")
print("The mean elevation is", elev_mean)
print("The standard deviation of elevation is", elev_std)

low_band = elev_arr[elev_arr < elev_mean-elev_std]
middle_band = elev_arr[(elev_arr >= elev_mean-elev_std) &
                       (elev_arr <= elev_mean+elev_std)]
high_band = elev_arr[elev_arr > elev_mean+elev_std]

print()
print("# Low band statistics")
print("The mean elevation of the low band is", low_band.mean())
print("The xtandard deviation of the low band is", low_band.std())

print()
print("# Middle band statistics")
print("The mean elevation of the middle band is", middle_band.mean())
print("The xtandard deviation of the middle band is", middle_band.std())

print()
print("# High band statistics")
print("The mean elevation of the high band is", high_band.mean())
print("The xtandard deviation of the high band is", high_band.std())

# upper left
plt.subplot(221)
plt.imshow(elev_arr)

# upper right
plt.subplot(222)
plt.plot(low_band)

# bottom left
plt.subplot(223)
plt.plot(middle_band)

# bottom right
plt.subplot(224)
plt.plot(high_band)

plt.show()3 Explanation
We need these two modules.
from osgeo import gdal
import matplotlib.pyplot as plt
Define the read_geotiff() function that reads a GeoTIFF and its NumPy array.
def read_geotiff(filename):
    ds = gdal.Open(filename)
    band = ds.GetRasterBand(1)
    arr = band.ReadAsArray()
    del ds, band
    return arr
Now, call this function to read a GeoTIFF file and get a NumPy array.
elev_arr = read_geotiff("elevation.tif")Using the mean() and std() functions in the NumPy array class, calculate the mean and standard deviation of the elevation data.
elev_mean = elev_arr.mean()
elev_std = elev_arr.std()
Print the elevation statistics. The print() function can take an arbitrary number of arguments to print. For example, print("The mean elevation is", elev_mean) prints the string The mean elevation is and a number in elev_mean separated by a space.
print("# Elevation statistics")
print("The mean elevation is", elev_mean)
print("The standard deviation of elevation is", elev_std)
Extract elevation cell values that are less than the mean minus standard deviation. Here, we use elev_arr < elev_mean-elev_std to create a boolean array for indexing elev_arr. The shape of this boolean array is the same as that of elev_arr. elev_arr[elev_arr < elev_mean-elev_std] returns elev_arr cell values whose boolean counterpart in elev_arr < elev_mean-elev_std is True. It returns a 1-dimensional array.
low_band = elev_arr[elev_arr < elev_mean-elev_std]For the middle band, we need to extract cell values that are between two numbers: the mean minus standard deviation and the mean plus standard deviation. In this case, we cannot use the regular and combine >= and <= conditions because this operator takes two bool operands, but conditioning boolean arrays are not of the bool type, but they are arrays of bool. The & operator combines two boolean arrays element-wise and create a new boolean array of the same shape. In this case, the shapes of elev_arr >= elev_mean-elev_std and elev_arr <= elev_mean+elev_std are the same as that of elev_arr. We use parentheses () to make sure that each boolean operand is evaluated first. Without parentheses, the & operator will take elev_mean-elev_std and elev_arr, which have different shapes.
middle_band = elev_arr[(elev_arr >= elev_mean-elev_std) &
                       (elev_arr <= elev_mean+elev_std)]
Last, we extract high-band elevation cells.
high_band = elev_arr[elev_arr > elev_mean+elev_std]print() prints an empty line to separate output lines.
print()
print("# Low band statistics")
print("The mean elevation of the low band is", low_band.mean())
print("The xtandard deviation of the low band is", low_band.std())

print()
print("# Middle band statistics")
print("The mean elevation of the middle band is", middle_band.mean())
print("The xtandard deviation of the middle band is", middle_band.std())

print()
print("# High band statistics")
print("The mean elevation of the high band is", high_band.mean())
print("The xtandard deviation of the high band is", high_band.std())
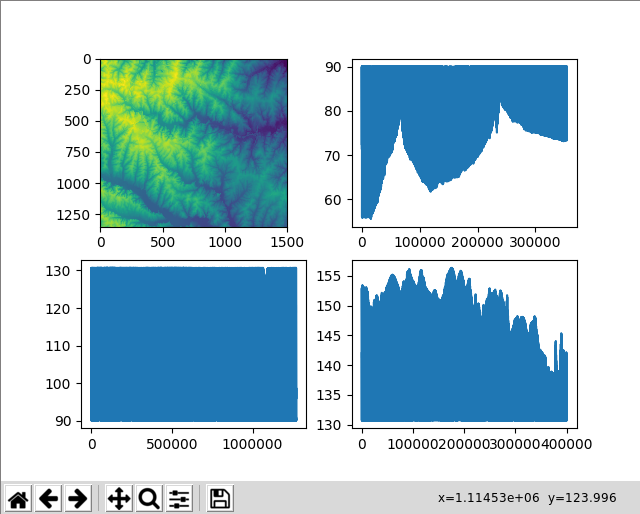
Let’s plot these data in a 2-by-2 grid. plt.subplot(221) means that we want to create a 2-by-2 grid (the first 22) and place the following command at index 1. Subfigure indexing starts from the upper-left corner using 1-based indexing and grows towards the right and then the bottom.
# upper left
plt.subplot(221)
plt.imshow(elev_arr)

# upper right
plt.subplot(222)
plt.plot(low_band)

# bottom left
plt.subplot(223)
plt.plot(middle_band)

# bottom right
plt.subplot(224)
plt.plot(high_band)

plt.show()