How to calculate the normalized difference vegetation index in ArcMap
- 1 Vegetation and the electromagnetic spectrum
- 2 What is the normalized difference vegetation index (NDVI)?
- 3 Landsat 8
- 4 Download Landsat 8 data
- 5 Extract the Landsat 8 data
- 6 Start ArcMap
- 7 Add the red and infrared bands
- 8 Add basemap
- 9 Start the raster calculator
- 10 Calculate the red surface reflectance
- 11 Calculate the near infrared surface reflectance
- 12 Calculate the NDVI
- 13 NDVI
1 Vegetation and the electromagnetic spectrum
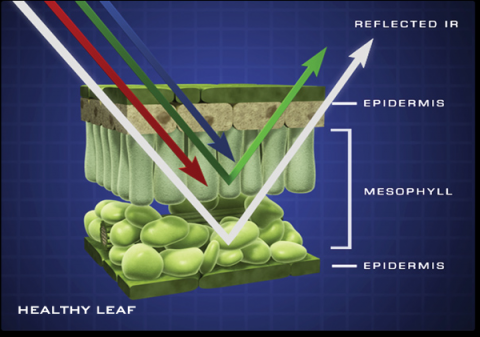
Plants absorb red (R) and blue (B) lights to generate energy and create chlorophyll. This process is called photosynthesis. They reflect green (G) lights and near-infrared (NIR, invisible). This reflection of green lights makes vegetation look green.
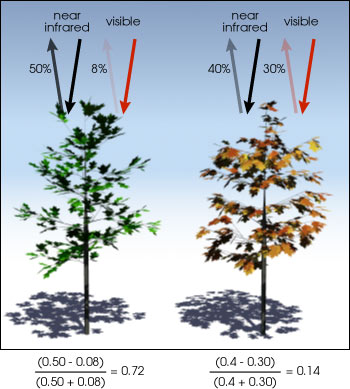
During a growing season, chlorophyll in leaf cells actively absorb red and blue lights (decreasing red reflectance) and reflect green and infrared (increasing infrared reflectance), which leads to an increased ratio of \[ \def\NIR{\text{NIR}} \def\R{\text{R}} \frac{\NIR}{\R}. \]
2 What is the normalized difference vegetation index (NDVI)?
The range of $\frac{\NIR}{\R}$ is from 0 to infinity, which is not ideal to handle. This spectral ratio can be transformed into the following form: \[ \frac{\NIR}{\NIR+\R} \] which ranges from 0 to 1.
Finally, the NDVI is defined as \[ \def\NDVI{\text{NDVI}} \NDVI=\frac{\NIR-\R}{\NIR+\R} \] which varies from -1 to 1.
3 Landsat 8
Landsat 8 is a satellite that orbits the Earth and collects spectral data in 11 different bands.
| Band no. | Spectrum | Wavelength ($\mathrm{\mu m}$) | Resolution ($m$) |
|---|---|---|---|
| 1 | Deep blues and violets | 0.433–0.453 | 30 |
| 2 | Visible blue (B) | 0.450–0.515 | 30 |
| 3 | Visible green (G) | 0.525–0.600 | 30 |
| 4 | Visible red (R) | 0.630–0.680 | 30 |
| 5 | Near infrared (NIR) | 0.845–0.885 | 30 |
| 6 | Shortwave infrared (SWIR) 1 | 1.560–1.660 | 30 |
| 7 | Shortwave infrared (SWIR) 2 | 2.100–2.300 | 30 |
| 8 | Panchromatic (PAN) | 0.500–0.680 | 15 |
| 9 | Cirrus (clouds) | 1.360–1.390 | 30 |
| 10 | Thermal infrared (TIR) 1 | 10.6–11.2 | 100 |
| 11 | Thermal infrared (TIR) 2 | 11.5–12.5 | 100 |
4 Download Landsat 8 data
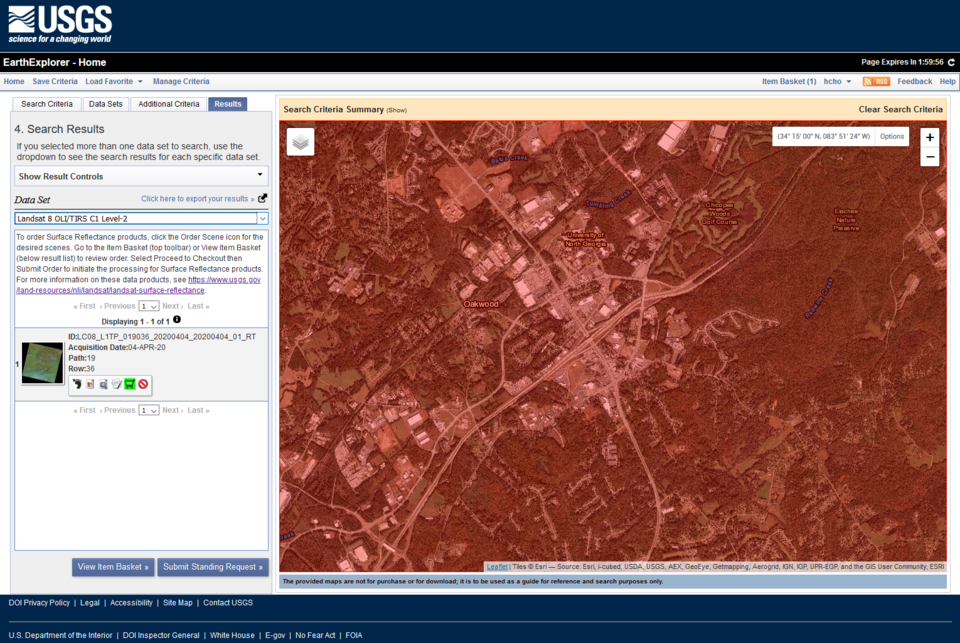
You need to log in to EarthExplorer first to download data.
4.1 Search criteria
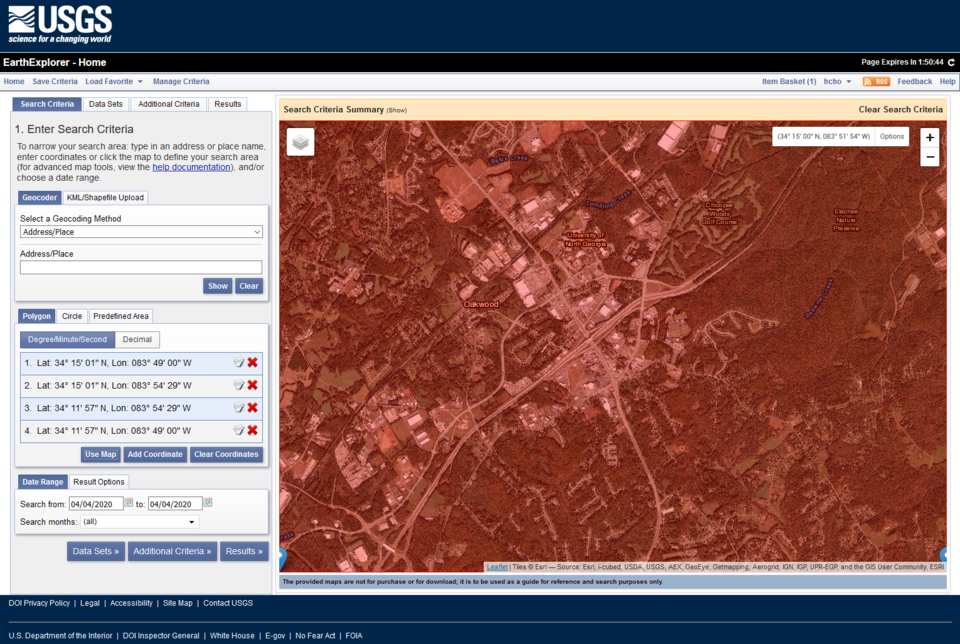
Use the Use Map button to set your study area in the EarthExplorer and move to the Data Sets tab.
4.2 Data sets
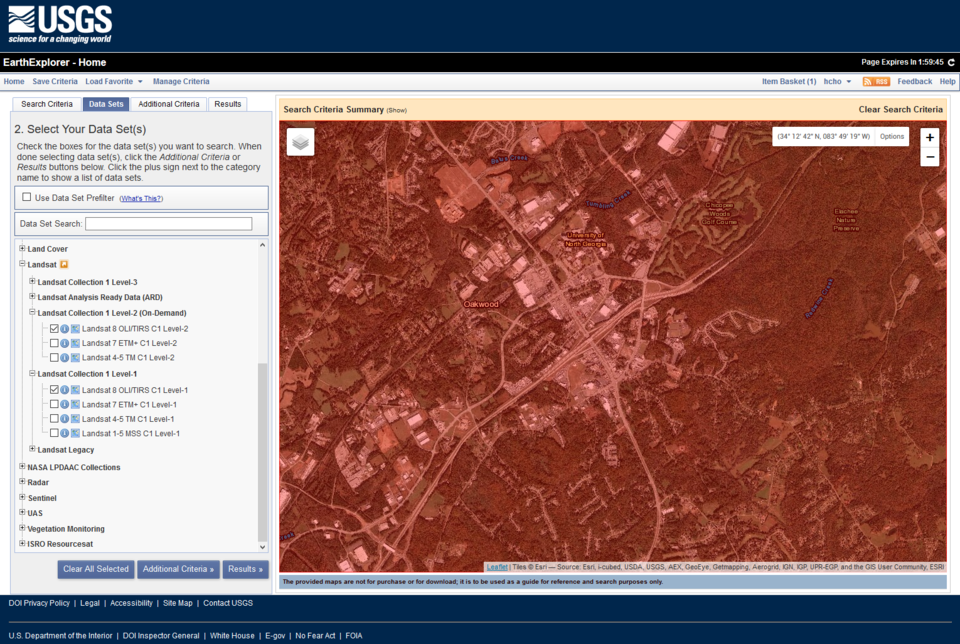
Select Landsat 8 OLI/TIRS C1 Level-2. Level-1 data is called top of atmosphere (TOA) and not corrected atmospherically while level-2 data is called bottom of atmosphere (BOA) and provides surface reflectance data. Since we are trying to calculate a vegetation index, we need level-2 surface reflectance. However, it will take time to complete our request for level-2 data.
4.3 Additional criteria
Add some additional criteria.
4.4 Results
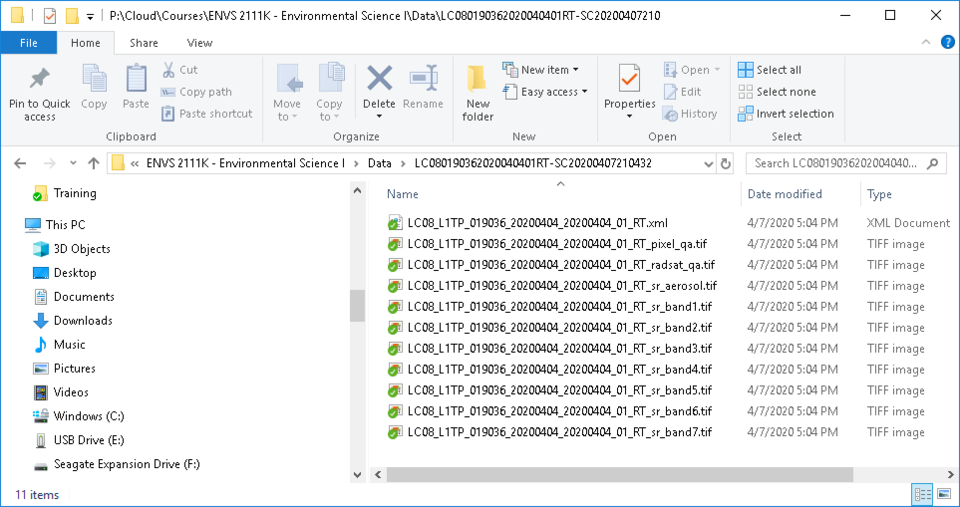
Once you submit your request for level-2 data, you will receive a confirmation email followed by an email with a download link. It can take long depending on the size of your study area. The level-2 data will be in the tar.gz extension. You can use 7-zip to extract this file format. For this exercise, download the level-2 data for the UNG Gainesville campus at LC080190362020040401RT-SC20200407210432.zip. tar.gz is recompressed as zip.
5 Extract the Landsat 8 data
Using the File Explorer, extract the ZIP file.
6 Start ArcMap
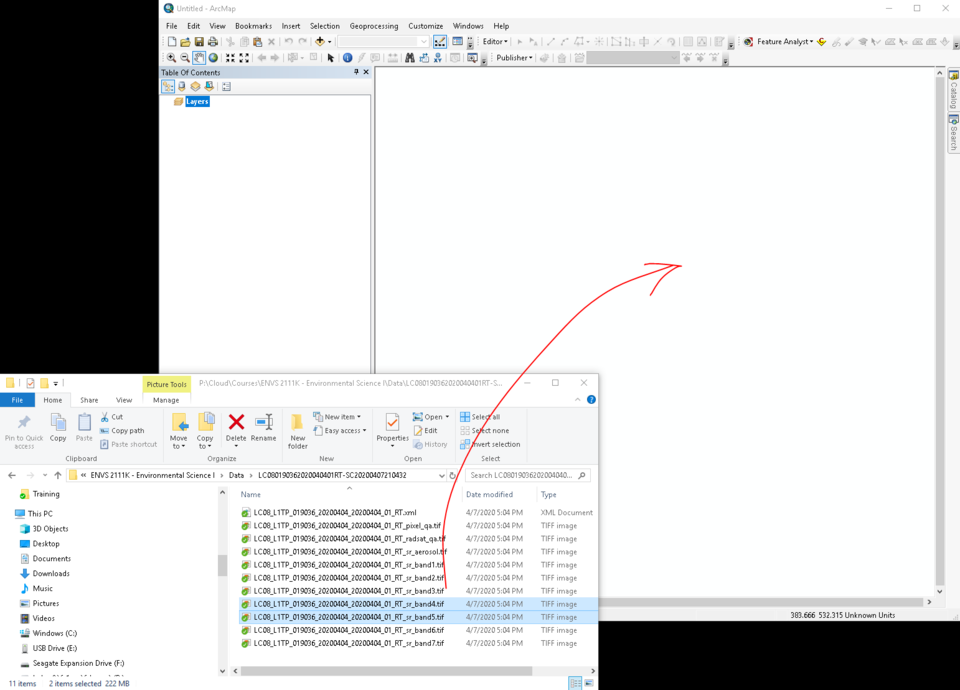
Click Cancel because you want to create a new map.
7 Add the red and infrared bands
Drag and drop bands 4 (R) and 5 (NIR) from the File Explorer into ArcMap.
8 Add basemap
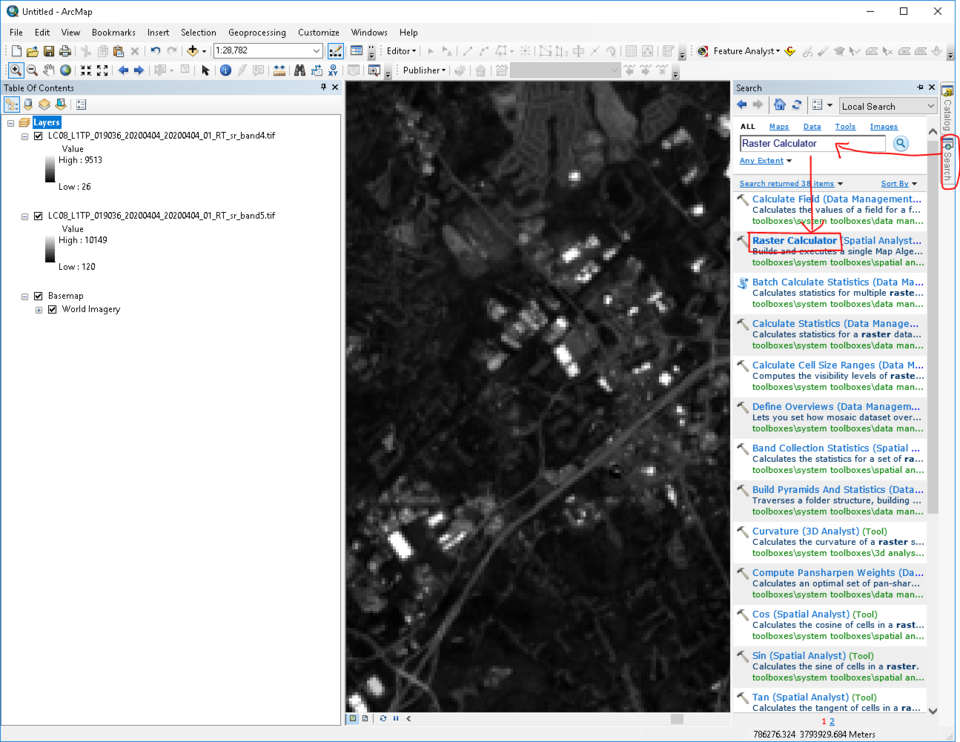
Add a basemap to find and zoom to the campus. Turning off the band layers will help.
9 Start the raster calculator
Find and start the raster calculator.
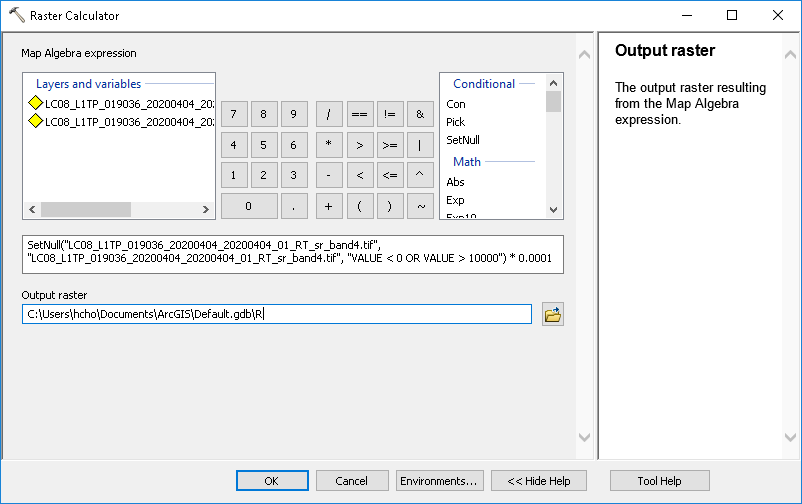
10 Calculate the red surface reflectance
SetNull("LC08_L1TP_019036_20200404_20200404_01_RT_sr_band4.tif", "LC08_L1TP_019036_20200404_20200404_01_RT_sr_band4.tif",
        "VALUE < 0 OR VALUE > 10000") * 0.0001
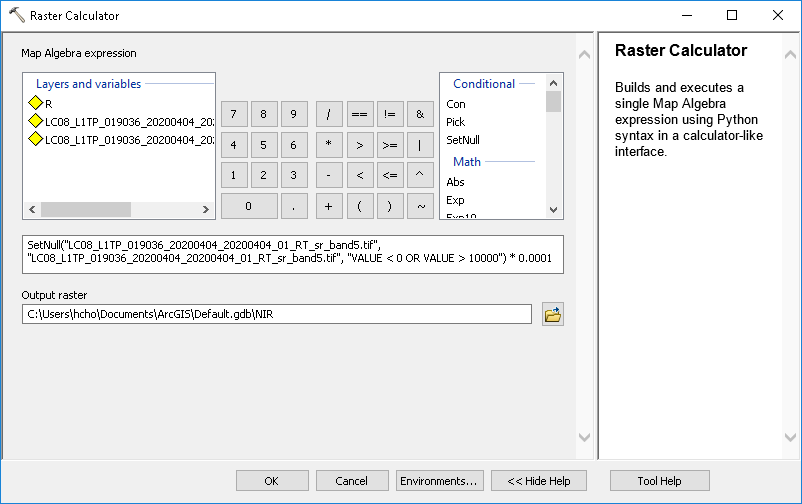
11 Calculate the near infrared surface reflectance
SetNull("LC08_L1TP_019036_20200404_20200404_01_RT_sr_band5.tif", "LC08_L1TP_019036_20200404_20200404_01_RT_sr_band5.tif",
        "VALUE < 0 OR VALUE > 10000") * 0.0001
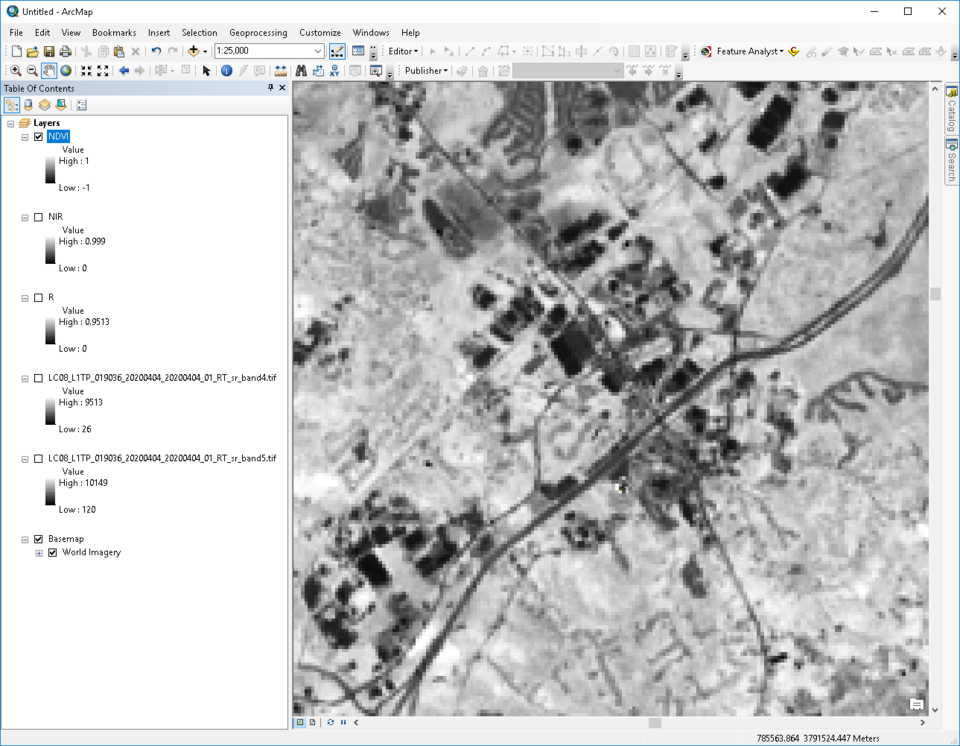
12 Calculate the NDVI
("NIR" - "R") / ("NIR" + "R")
